Stop Burning Budget on Poor Tests: an A/B Testing Best Practices Guide for Ecommerce Sites
A/B testing is a big investment for your ecommerce company, so you want to set it up right the first time.
Conducting an A/B test is the only way to get a data-based understanding of your customer’s purchase path. It allows you to use statistics to determine what your customers’ preferences are and what barriers they are encountering that stop them from buying:
Why are customers exiting before their checkout is completed?
Is it the number of checkout steps? Is it the page load time?
If you’ve never run an A/B test, then you’re guessing that you know why your customers are behaving the way they do. You don’t have any concrete information to backup your reasoning.
If you have setup an A/B test before, then you may have some concrete information about your customer behavior.
But all information is not created equal, and that’s why A/B testing campaigns can be intimidating. You can watch all of the A/B testing tutorials you can, and it’s still difficult to know if you’ve set up your campaign correctly. How can you know that you’re structuring your campaign so that it returns the most actionable data for your team?
This article will guide you through creating a foolproof A/B test from the beginning, so that the test you run produces the most accurate results possible.
Let’s start with a quick review of A/B testing, then we’ll get into tactics to make your campaign the best that it can be.
How to do A/B testing
If you’re not familiar with the concept of A/B testing, it’s an experiment where you compare results between 2 versions of a page or element (landing page, headline text, button color, etc.) to determine which one performs better. Using a statistical approach, you can test your hypothesis on a sample of users and optimize conversions depending on the results.
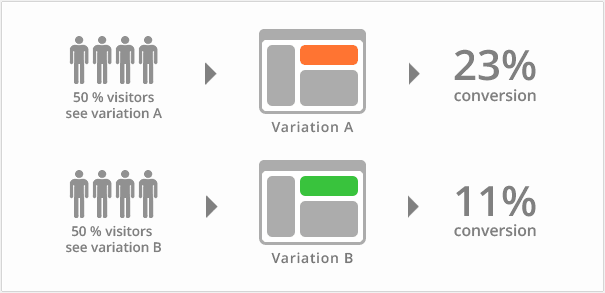
As an ecommerce company, you have a lot to gain from A/B testing. You can test all of your assumptions on your user’s actual experience, and make solid business decisions that can significantly improve conversions and sales because data doesn’t lie.
Let’s say you want to increase the number of completed checkouts, grow the average order value, or improve customer lifetime value. You can do this by A/B testing checkout funnel components, navigation and design elements, and webpage content like copy, calls to action, or the headlines you use.
This allows you to develop an intuitive understanding of your consumers, enabling you to truly understand their demands.
Setting up the best possible A/B test doesn’t have to be difficult. You just need to make sure you have asked yourself and your team the right questions before you launch your campaign.
Let’s look into how you can fool proof your ecommerce A/B tests in 5 easy steps:
1. Determine your conversion goal
Before you create your A/B test, it’s important to determine what you define as a ‘conversion’. While increasing revenue remains the primary goal of optimization, it’s important not to miss out on other data points that may influence user behavior. Factors such as the the number of clicks on your call to action, number of contact forms submitted, and email signups are all important metrics to test. All of these can – and do – contribute to increasing revenue.
The whole point of doing an A/B test is to determine whether your results are ‘significant’ and carry meaning. If your results are ‘significant’, that means they held true even if all external & cyclical factors were eliminated. When a test’s results are deemed significant, you’d select the variation in the test (either A or B) that produced the best percentage of conversions.
Since the ultimate end goal of an A/B test is determining what converts better, it’s imperative you establish what a conversion means to you before beginning. You’ll want your A/B test to be as accurate as possible, and clarifying this beforehand can save you time and money.
Calculating Significance
Once you determine your conversion goal, you now need to understand how you can accurately calculate the statistical significance of your A/B test. Most tools like VWO use a calculator to determine the significance of test results. This is based on the assumption that the site operates at just 1 price point, and the number of conversions and visitors are both in the same ‘unit’ of measurement.
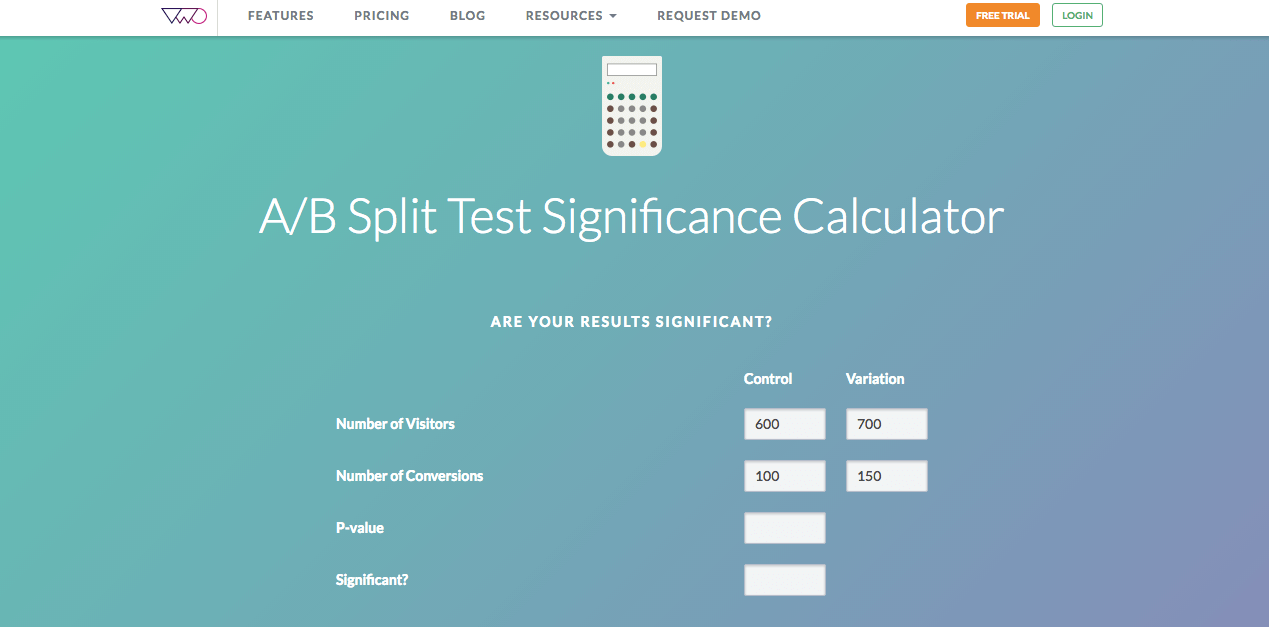
However, this is rarely the case. Most ecommerce sites operate at multiple price points, and the number of visitors never aligns 1:1 with conversions (if it does, virtual high fives!). So, the above calculations can be misleading. Therefore it becomes necessary to use a metric that is inclusive of price variations. You can do this by using this formula:
Annual Incremental Revenue Added = (Monthly Traffic x New Conversion Rate x New AOV x 12) – (Monthly Traffic x Old Conversion Rate x Old AOV x 12) (source)
The above formula will tell you how much your conversion has contributed to increasing revenue, giving more meaning to what a conversion really means to your business.
Let’s use this hypothetical data to calculate annual incremental revenue added through an A/B test:
Webpage Variation A (New Version)
- Monthly Traffic = 1000 visitors
- New Conversion Rate: 20%
- New Average Order Value (based on value of orders placed on the new variation): $500
- Number of Months In A Year: 12
Webpage Variation B (Old Version)
- Monthly Traffic: 1000 visitors
- Old Conversion Rate: 10%
- Old Average Order Value (based on value of orders placed on the old variation): $450
- Number of Months In A Year: 12
Therefore, the annual incremental revenue added due to this hypothetical A/B test would be:
(1000 Visitors * 0.20 Conversion Rate * $500 AOV Per Month * 12 Months) Minus (1000 visitors * 0.10 Conversion Rate * $450 AOV Per Month * 12 Months) = $1,200,000 – $540,000
This represents a $660,000 increase in annual incremental revenue, which is massive.
Calculating Revenue Per Unique Visitor
Another great metric that gives great insight into the results of your A/B tests is the revenue per unique visitor. This can be calculated by dividing the total revenue generated per visitor by the total number of visitors on each variation.
For each variation calculate: Total Revenue per Visitor / All Visits
This value smooths out the variation you may see because you have many different prices in your store, and is very useful in determining the success your A/B test.
Let’s take a look at some examples of A/B tests:
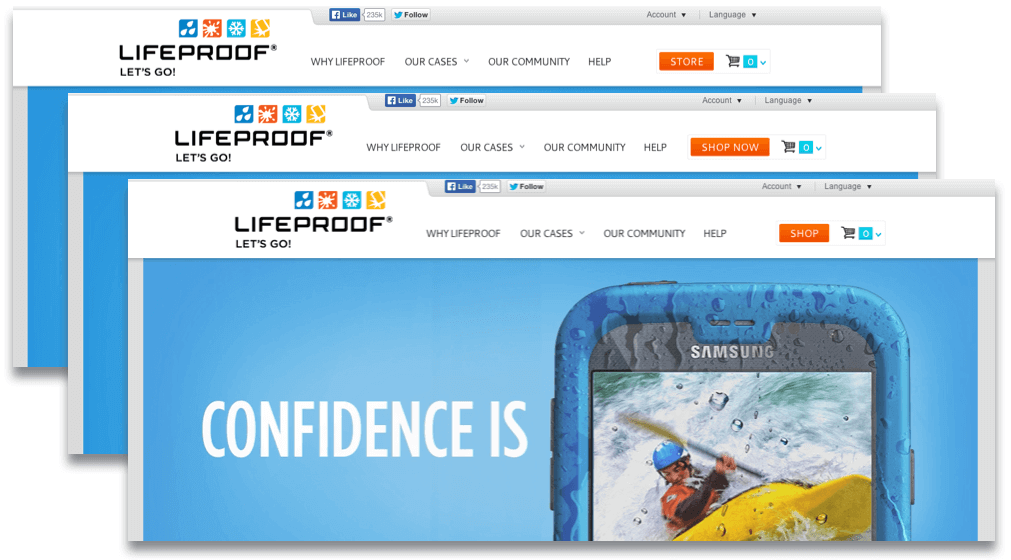
Lifeproof, an outdoor electronics accessories company, A/B tested 2 versions of a purchase button call to action on their site. One said “Shop”, and another said “Shop Now”. Users responded more to the “Shop Now” button, resulting in a 12.8% increase in click through rates, leading to a 16% uplift in monthly revenues. (source)
Check out how The Clymb, an outdoors gear and apparel company pushing the boundaries in their industry and the natural world, increased their conversion rates by A/B testing a standard web page against a personalised one to improve conversions in our recent post on personalizing your customer’s online shopping experience.
Even small changes like the ones made by Lifeproof can make a huge difference to your conversions. In order to best determine which elements of your site to test, it’s best to utilize data and analyze problems to identify the best opportunities on your site for optimization.
2. Sample Size
Sample size is the number of visitors you’re conducting the A/B test against.
It’s important to focus on getting to a statistically significant result as soon as possible, and prioritize that over ‘sample size’. But the question remains: how large should a sample size be to arrive at a significant result?
The simple answer is that you don’t want to come to conclusions on the basis of a small sample size. The best way to estimate required sample sizes accurately is to use your current/baseline conversion rate, your desired detectable effect (the desired change you’d like to see in your conversions – usually a percentage value) in the conversion rate, and your desired statistical confidence to generate a sample size number. You can do this by using this calculator from Optimizely.
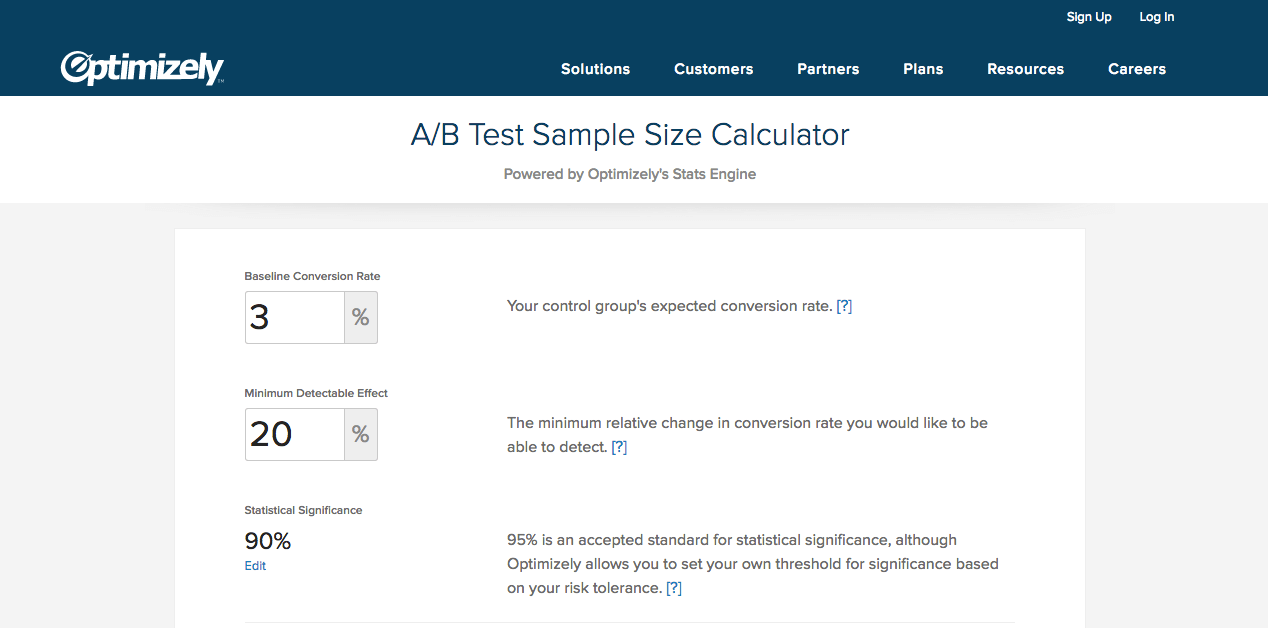
This number gives you a large enough sample size for each variation on your test, backed by a solid statistical formula used in the calculator.
You can get baseline conversion rates from having a look at historical data on your site, as well as by utilizing Google Analytics. The minimum detectable effect (MDE) is the range of the change in the baseline conversion rate you want to detect. So, if your baseline conversion rate is 20% and your MDE is 10%, your A/B testing tool will detect any changes outside of the 18%-22% conversion rate range (basically, a 10% MDE implies a 2% absolute change in conversion rates, up or down). Tools like Optimizely allow you to set the statistical level of significance, depending on how much accuracy you desire to make decisions.
3. Test Duration
While there’s no straight answer on how long your tests should run, the key is to run them until the traffic you’re testing represents your ‘most normal’ website traffic.
For example, if you’re selling gift items online, it’s natural to expect a spike in traffic during Christmas. You can be inclusive in your approach to such external factors by running your tests for a minimum of 1-2 ‘business cycles’, depending on the nature of your business.
If the test duration factors in what’s happening each day of the week on your website, accounts for visitors who may return to your site at a future date, and accounts for any other various different traffic sources, you’re on the right track.
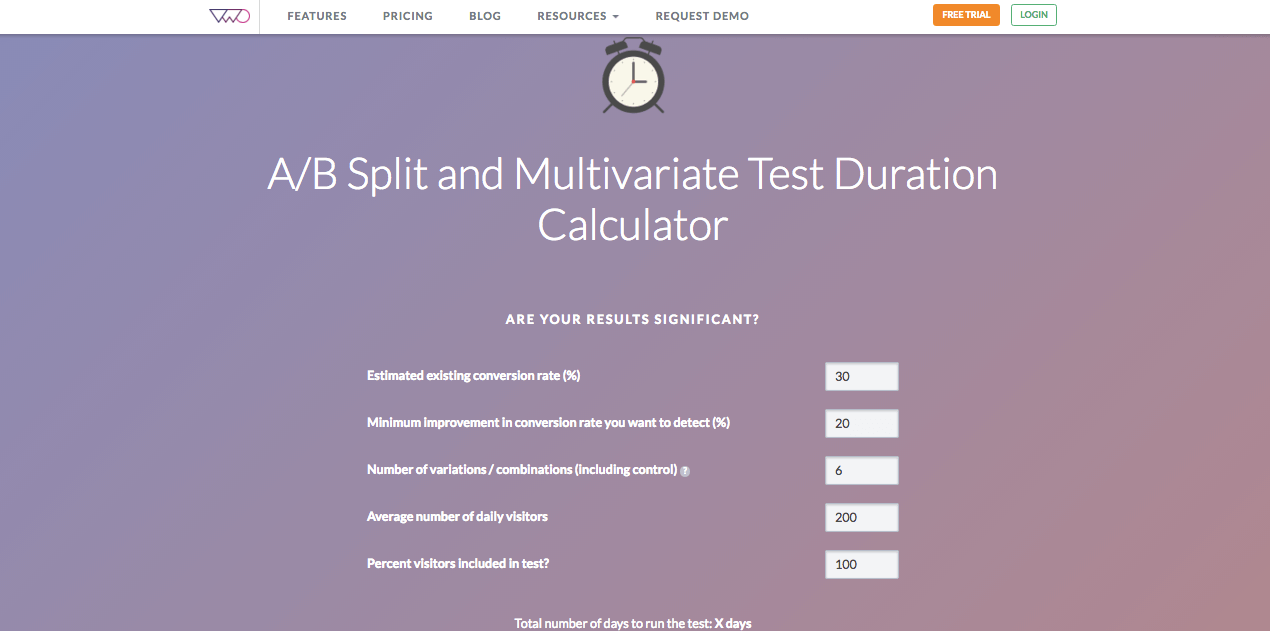
Here’s another calculator from VWO that can help you accurately estimate test duration times. Depending on your desired detectable change in conversion rates and the average number of daily visitors, this calculator gives you the right number of days to run your test.
4. Statistical Confidence
Statistical confidence is the likelihood that your A/B test will give the same result if it is run at some point in the future. (source)
While softwares provide you with the statistical confidence of your test results, how can you be sure it’s accurate? The standard level of significance utilized by most softwares is 90%, but this doesn’t necessarily count all considerations.
Given that statistical confidence is valid only for a specific time period, it becomes necessary to continue to test across time periods. This requires the ability to balance your present test results with future iterations in your A/B tests.
You can only be sure about the permanence of your results by continuing to test, and then comparing the results with the original test outcome. If the result is still the same, you’ll have more confidence in the stability of your results. (source)
By ensuring you’ve tested for a long enough time period, you reduce the margin of error in your A/B tests. Never be in a rush to come to a conclusion on your tests! It’s tempting, but you must resist the temptation in order to make the best informed decisions for your business.
A good rule of thumb is to make sure you conduct tests over at least 1 full week. Each day is different for your ecommerce business, and conducting tests only for a few specific days can be a huge mistake. The following image demonstrates the amount of variation across each day of the week.
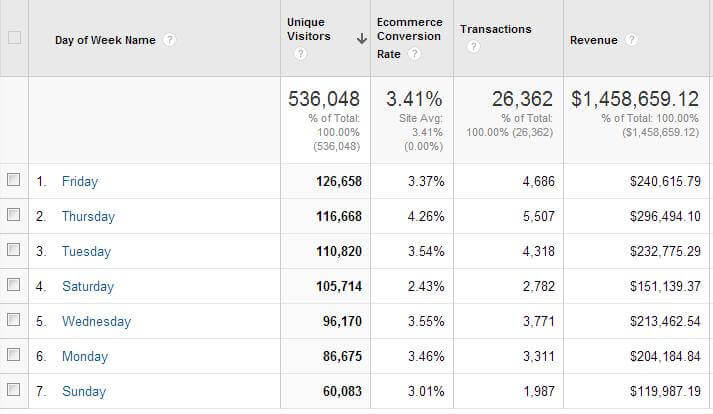
In this example Thursdays and Fridays are the busiest days of the week, and produce nearly twice the amount of revenue compared to Sunday. This highlights the importance of taking each day of the week into account. Ideally, you want to run your tests for at least 4 weeks (7 days a week) to achieve confidence. Always conduct follow up tests if you’re in doubt. (source)
5. Re-test against original Control after picking winner
After executing the initial A/B test on your ecommerce site, it’s a best practice to retest the results after 6-12 months. This provides you with the assurance that the results you obtained weren’t just due to any outside factors (like spiked holiday traffic), and are still valid.
For this second test , it’s important that you use your same solution to re-test against the control (Optimizely, VWO). Use copies of both the original control version, as well as the latest winner for the retesting process, so that you benchmark the results against the right base and minimize any margin of error.
This can be a time consuming process, and it’s only worthwhile if you take the time to set up your test correctly from Day 1. No matter if you’re seeing a small decrease or a significant drop in conversions, there’s always room to improve and do it better. Testing is the first step in diagnosing your problem and can help get your company back on a path to being a more profitable online store.
Build Your Own A/B Testing Framework
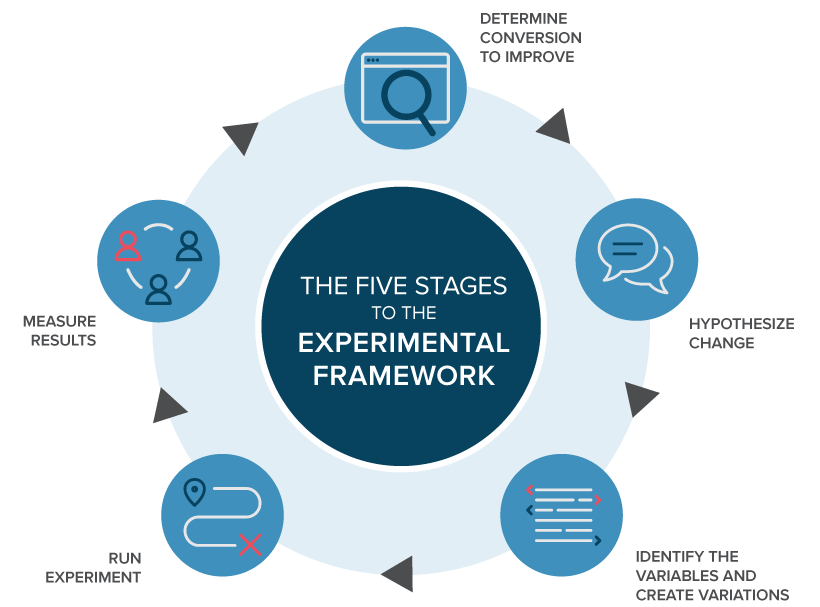
Setting up an A/B test that will give you the most accurate data you need to make a smart and informed decision for your store can be done! It’s the only way you’ll enable your ecommerce website to evolve along with your customer. Consider each of the 5 steps outlined above and you’ll start your campaign off on the right foot.


