
How to track the KPIs that matter in Google Analytics
Successful ecommerce managers make decisions not on hunches, personal leanings or even one-off patterns; they make decisions based on metrics.
These managers know the state of their store’s performance, buyer behaviour, product trends, and the parts of your store that deserve the most promotion.
While there are thousands of metrics for stores to track, only a few KPIs are relevant to the state of your store. These are the metrics that can be turned into actionable insights for your store to accelerate your path to scale.
Which metrics should you care about?
While there are hundreds of metrics worth reviewing over time, only a few KPIs offer a true measurement of your ecommerce performance:
- Customer Acquisition Cost (CAC)
- Shopping cart abandonment rate
- Product page load speed
- Average Order Value (AOV)
- Customer Lifetime Value (CLV)
We’ll dive into each KPI, including how to 1) calculate them and 2) measure them in Google Analytics. Each of these KPIs are great indicators of progress or areas for improvement for your online store.
Knowing the GA basics
There’s one GA metric that sometimes goes overlooked among the sea of metrics — your audience. GA can provide diverse and segmented info about your store visitors, including:
- Where they live
- What language they primarily speak
- Their on-page behavior
- Their browser and device info
- Their age, gender and income
- The type of customer (first time or returning)
This data is valuable because it offers insight as to how visitors interact with your store, while empowering you to test landing pages and product pages in a way that caters to visitors’ behaviors.
GA also provides a flowchart that shows which landing page brought visitors to your site in the first place, the pages they scrolled on your store, the products they bought, and how long they were exploring your site.
And let’s not forget traffic sources. GA provides rich data on where your visitors come from online — if they’re coming to your store directly (by typing in your URL) or through a browser search (Google, Facebook, or another place where ads may be shown).
Now let’s get into the good stuff — tracking the KPIs that matter.
How to track Customer Acquisition Cost (CAC)
Why does it matter?
It’s a no-brainer that every business wants as many customers as possible — but not if it means going bankrupt. Online stores need to track customer acquisition cost (CAC) to know exactly the “debt” they incur to bring a single customer on board. CAC is literally a calculation of what it costs to acquire an average customer.
For the most part, if your store is losing money every time a customer makes a purchase, you won’t be in business very long.
CAC and cost per acquisition often get mixed up, but they’re two distinct metrics that measure different things.
CPA is an “umbrella” term that covers a number of acquisition events, like a user opt-in or a click. On the other hand CAC is the actual cost to acquire a paying customer (or subscriber).
When it comes to CAC, it doesn’t matter how your lead arrived — whether through a landing page, paid search, a blog post or a free trial offer. This metric is an “overall” metric that accounts for every customer purchase within any given period.
How do you track CAC in Google Analytics?
The simple formula for calculating CAC:
CAC = Sales & marketing costs / # of customers brought on board (within given time period)
Here’s where you can find CAC in Google Analytics:
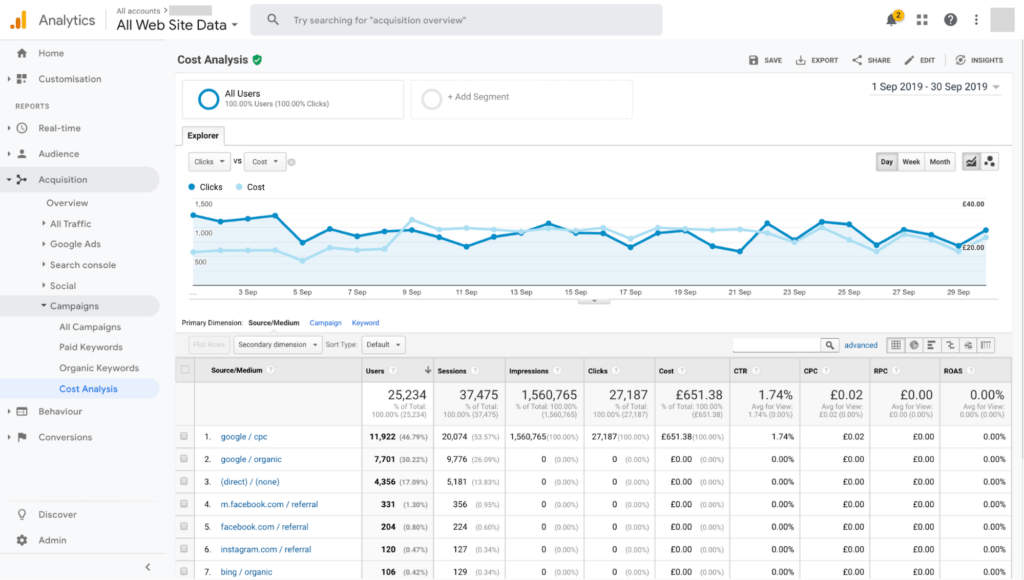
Example:
Alice runs a Shopify store that sells online accessories for women in their 20s. From January 2019 to July 2019, Alice spent $800,000 in sales and marketing (paid search, content marketing, team salaries, etc.).
During the same time frame, Alice sold 80,000 accessories on her store. Alice’s customer acquisition cost for that 6-month period is $10.
Related metrics that matter
Sales conversion rate on mobile/desktop
This is a vital comparison between desktop and mobile and which pages and products convert better on which devices. Typically, desktop conversion rates are more than double that of mobile.
However, average add to cart rates aren’t trailing by much. In fact, SaleCycle says the average mobile add to cart rate is 10.4%, just a few percentage points behind desktop’s 12.9%. What does this mean? In short, more shoppers are bailing during or around the checkout process. More on that later.
Average email signup rate
According to Sumo, the average email signup rate is 1.95%, with the top 10% of email marketers above a 4.7% success rate.
Average referrals from Facebook/Twitter
Referral traffic is how Google reports visits to your online store outside of “normal” Google searches. This includes “outside sources” like Facebook and Twitter, both popular sources of referral traffic.
When someone clicks on a hyperlink to visit a page on your store, GA tracks that click as a referral visit from the social media platform being used.
Tracking shopping cart abandonment rate
Why does it matter?
While it’s not music to merchant ears, abandoned online carts are an unfortunate reality of ecommerce. People are often indecisive, distracted or compelled to go another direction with their purchase decision.
In fact, about 77% of customers who add items to their shopping cart will navigate away from the store without completing their purchase, according to SaleCycle.
However, it’s worth noting that rates depend largely on industry and type of store — a big-ticket fashion brand may experience a higher abandonment rate than a protein powder brand, for instance. And among those nutrition products, those sold by subscription (where you ‘subscribe’ to get a box of protein bars every month, for example), tend to see higher cart abandonment but also much higher lifetime value.
While every merchant experiences some degree of cart abandonment (it’s just a reality of ecommerce), it’s crucial to minimise your rate and recover any abandoned carts.
That’s exactly where GA comes into play. Whether you’re looking at customer segments, locations or devices of use, you can investigate differences to find the main culprits causing your shoppers to say goodbye before purchasing.
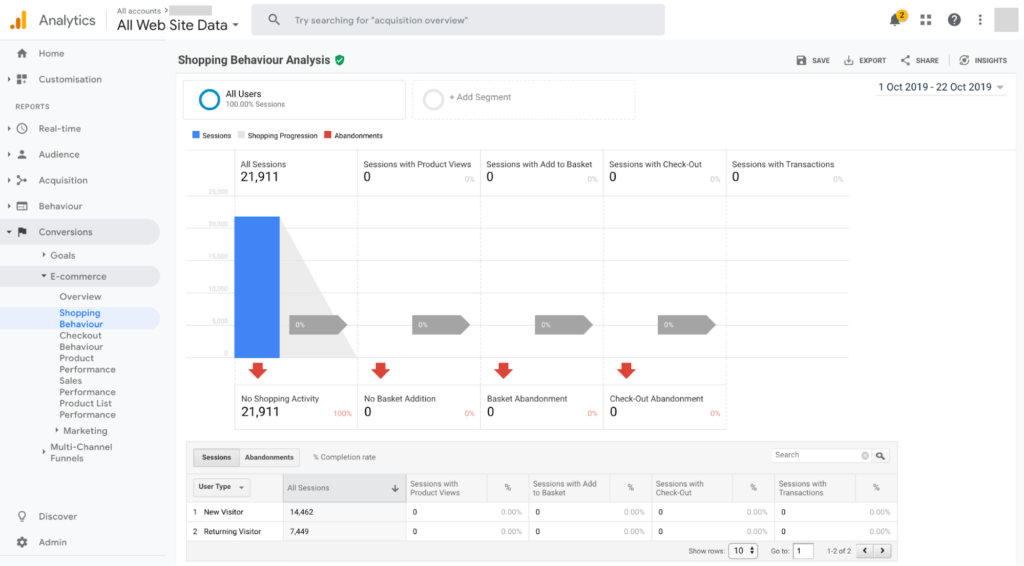
How do you track it?
While there is a manual route to tracking cart abandonment in Google Analytics (setting up a custom funnel), Google has since simplified it quite a bit.
Within GA, not only can you track cart abandonments for both new and returning visitors, but you can also track overall shopping activity, basket additions, basket abandonment and checkout abandonment rates. Most importantly, these metrics reveal the hiccups in the buying process — where exactly does the buck stop in your customers’ journey?
Here’s where you can find these numbers in Google Analytics:
Related metrics that matter
Average sessions per user
In August 2019, Littledata surveyed 3,623 sites and found the average pages per session was 3.0. If your site’s pages per session figure is between 1.8 and 4.7, you’re along the industry average. With less than 1.5, your store is underperforming.
Average sessions per user
A similar study found anything more than 1.7 sessions per user would put you in the 80th percentile of benchmarked sites, with more than 2.1 placing you in the 90th percentile. On the other hand, sessions per user of less than 1.2 would put you in the worst 20% of sites, with less than 1.2 placing you among the worst-performing sites.
Usage of site search
Google Analytics Site Search reports reveal the search terms users type, the pages where their search begins and the pages your search results page takes them to. With Site Search, GA offers helpful insights for your site content, store navigation and marketing campaigns.
Average product list CTR
Your average product list click through rate helps measure the customer draw and effectiveness of your product listings. Littledata also surveyed 265 stores in August 2019, finding that the average product list CTR was 1.7%. In other words, if your site has a product list CTR of between 0.8% and 4.7%, you’re within the industry average. then you are average compared with this benchmark.
Tracking product page load speed (zoom zoom)
Why does it matter?
With tens of thousands of online stores and growing competition, high consumer expectations are only getting more intense. Merchants have no choice but to meet those expectations (or fail out).
Especially with the recent dominance (and exponential growth) of mobile ecommerce and regular mobile transactions, shoppers expect pages to load quickly — or else. For many merchants, there’s always “the store next door” with comparable products, product values and consumer-friendly pricing.
In 2018, Pingdom measured their top 100 ecommerce sites against the 2-second load time (which is considered fast, but also an industry average for many sites). The result: 39% of the sites loaded within 2 seconds while 99% of the sites loaded in 5 seconds or less.
Pingdom did a nearly identical study three years ago, where 6% of their top 50 ecommerce sites took 5 or more seconds to load.
The conclusion: even with more data to support, sites are loading faster (especially on mobile) in order to measure up to shopper expectations.
How do you track it?
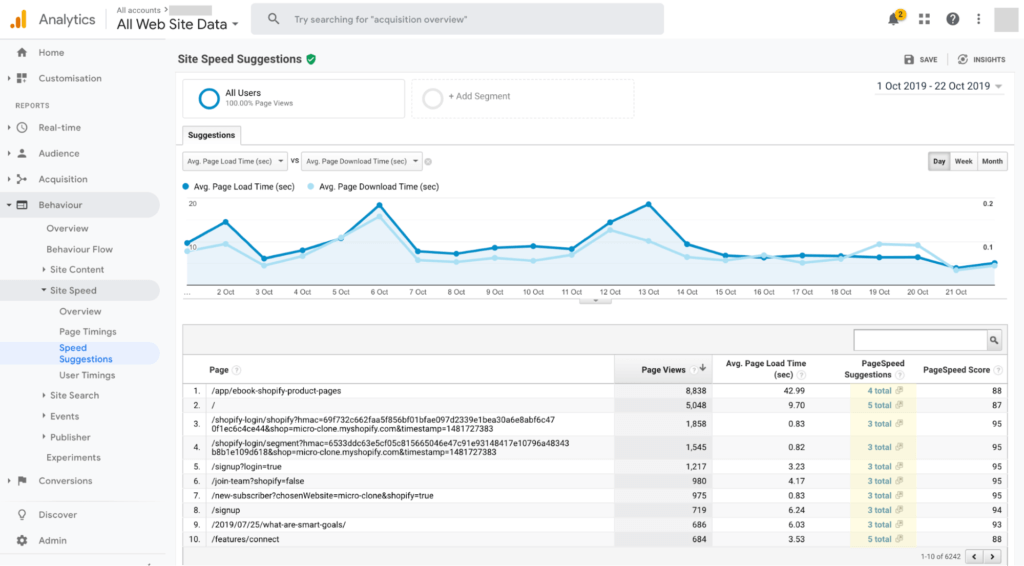
In Google Analytics, you can track page load speed for both your store product pages and your landing pages from the same place.
Under the Reports section, go to Behaviour > Site speed > Overview.
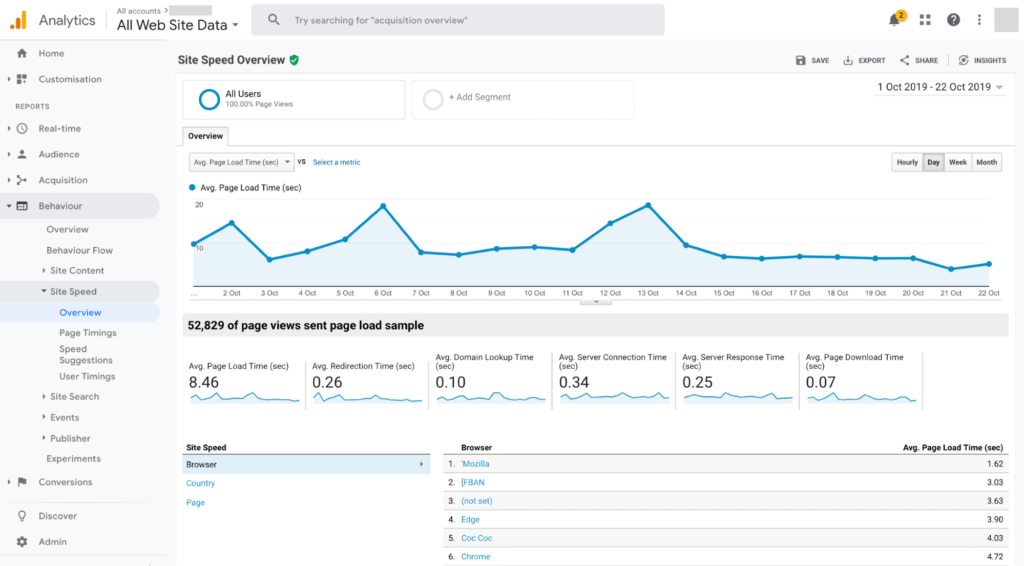
Here is some sample data showing the Overall view in GA:
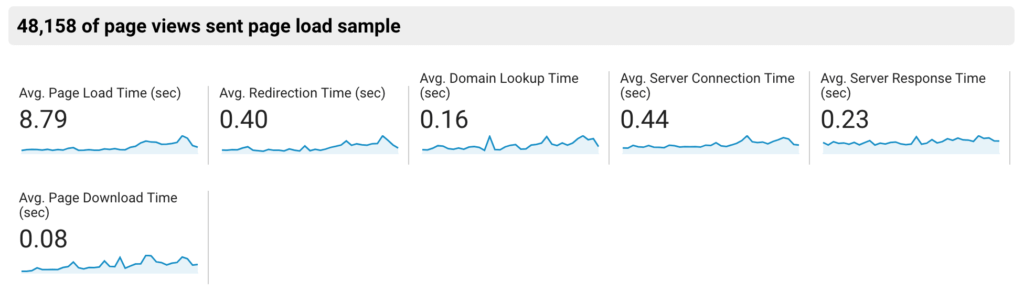
Google Analytics also offers site Speed Suggestions, which allows you to compare pages side-by-side and analyze the pages that are lagging:
Related metrics that matter
Bounce rate from mobile/desktop google search
Littledata surveyed 3,315 sites in August 2019 and found the average bounce rate from mobile Google search was 50.0%. On the other hand, RocketFuel found the average desktop bounce rate is roughly 41% to 55%, with any rate over 70% being lackluster, regardless of the type of page (blog, storefront, etc.)
Bounce rate from email campaigns
Unlike website bounce rates, there are two different types of email bounce rates: hard bounces and soft bounces. The main difference is hard bounces go undelivered without ever being accepted by the recipient’s email server while soft bounces are accepted by the server.
Bounce rate from Google Ads/Facebook Ads
For paid search, an average Google Ads bounce rate for ecommerce stores is between 56%-70%. For Facebook Ads, an average bounce rate is about 41%-55%.
Other relevant metrics you can track under Site Speed include Average delay before page content, Average time before full page load on mobile/desktop and Average server response time (redirection time).
Tracking Average Order Value (AOV)
Why does it matter?
In short, Average order value (AOV) is the average amount spent by your customers when they place an order.
Not only is AOV the “north star metric” for Shopify stores (and most other ecommerce stores), but it directly boosts revenue, making it a top priority for stores of all sizes.
While boosting revenue often means merchants do everything they can to acquire more traffic, AOV offers a better strategy — convince your customers to spend a little more, therefore increasing your revenue without having to acquire new customers.
Simply put, AOV is one of the primary KPIs in ecommerce because it measures sales trends and reflects both buyer preferences and buyer behaviour — insights that can be used to optimise your storefront, product pages, marketing campaigns and internal decision-making. AOV helps you determine what you choose to sell and how you choose to sell it.
Since your marketing budget will go further as you increase AOV, this metric is also a great indicator of how much room you have to optimise ROI.
When you invest time thinking of new strategies to boost AOV with current customers, you’ll see better product sales and bigger profits.
Just like other ecommerce KPIs, be careful to not view this metric in isolation. Customer lifetime value, add to cart rate and checkout completion rate also come into play.
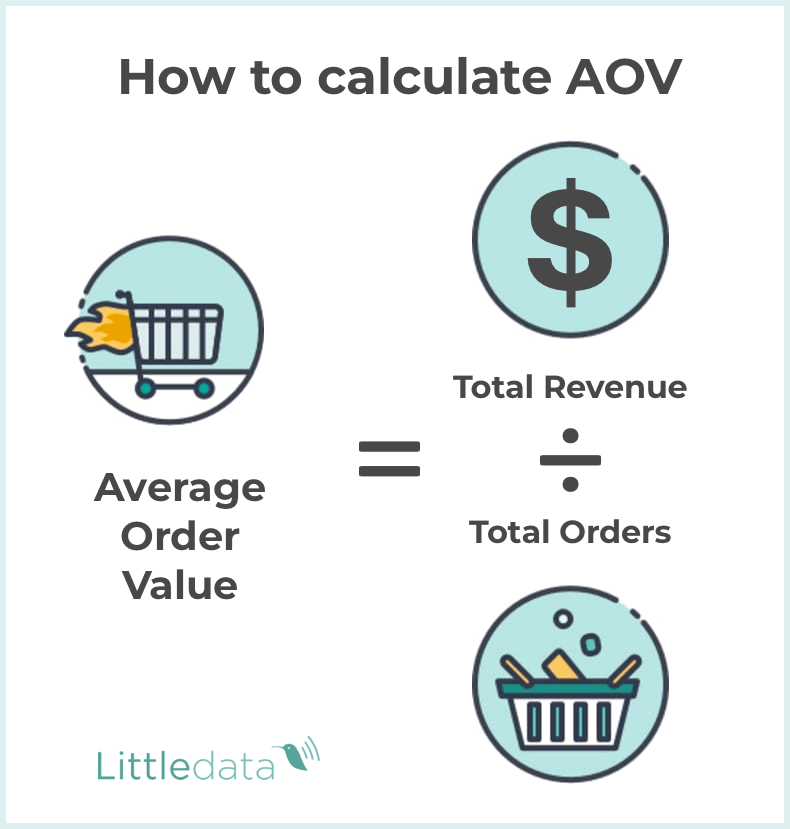
How do you track it?
To manually calculate AOV, divide your total sales (over a given time period) by the total number of orders. Littledata’s graphic below illustrates the basic equation:
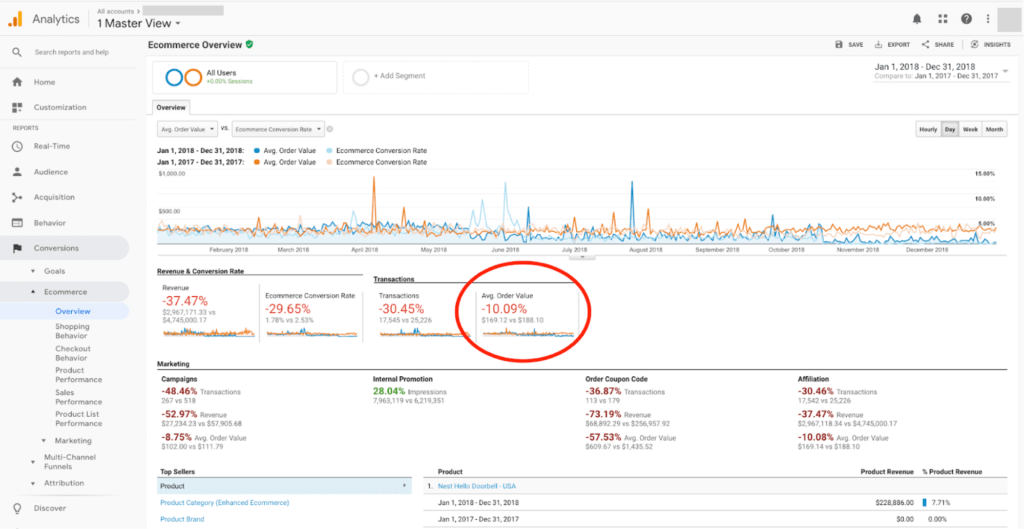
In Google Analytics, navigate to Reports, then Conversions > E-commerce > Overview. You’ll find average order value on the right hand side.
Related metrics that matter
Average add to cart rate
According to Smart Insights, the average add-to-cart rate is 10.9% (amongst their customer group), with the numbers slightly lower on mobile (9.4%) rather than desktop (12.5%).
Average checkout completion rate
In a recent survey of 509 stores, Littledata found the mean mobile checkout completion rate to be 41.4%, with an average performance range of 23.9% to 57.5%.
Customer lifetime value (CLV)
Why does it matter?
CLV measures how much each customer is worth to your business over the course of their buying life. Because every store sells different products at varying price points and in diverse markets, CLV isn’t a “one size fits all” metric.
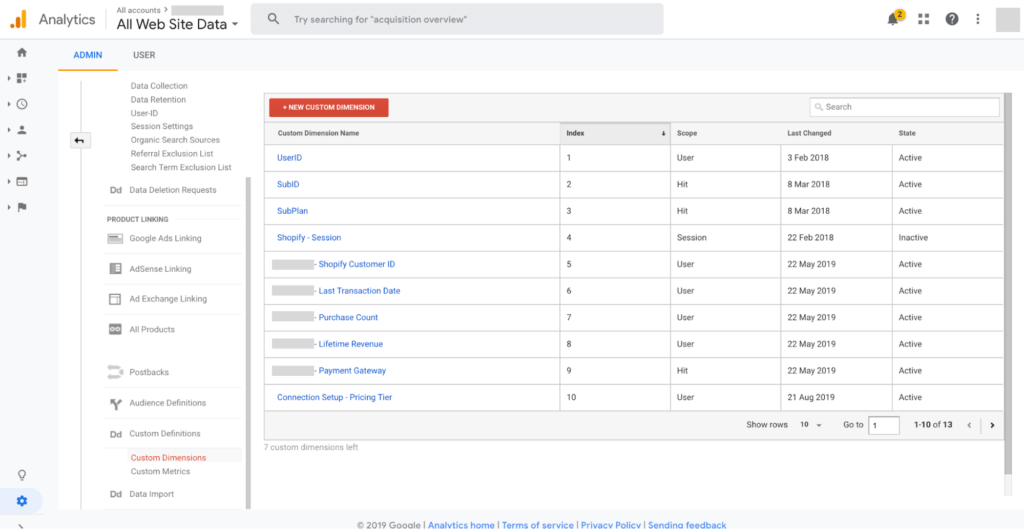
In GA, many merchants gauge their customer value by using ecommerce tracking to measure their first order value. Unfortunately, this data misses a crucial detail by not taking into account how long those shoppers will continue to buy from your store (or subscribe, if you run a subscription store).
By segmenting data in GA with custom dimensions, you can ensure a proper analytics setup and know for sure your CLV is being accurately tracked. It also means you can target customer loyalty campaigns and discover new customers with lookalike audiences:
KPI strategies for different types of brands
Just as different types of metrics aren’t measured the same way, different types of purchases (one-off, first-time, repeat, or recurring) require different strategies to maximise profits — and different KPIs to track along the way.
Smaller catalog stores
For stores that run with only a handful of products (and typically rely on one-off sales), no metric is more important than conversion rate.
Calculating conversion rate is simple: just divide the number of purchases (from a given time period) by the total number of sessions. Many shoppers will take more than one session on your store to purchase, but this is the standard way to measure how effectively your store is converting shoppers into buyers.
Outside of Google Analytics, industry benchmarks can help you “take your temperature” in terms of your conversion performance. In September 2019, Littledata surveyed 1,127 stores found the average conversion rate was 1.4%.
This means that anything more than 3.1% would put you in the top 20% of stores, while a rate above 4.8% would put you in the top 10%.
On the flip side, an ecommerce conversion rate (on desktop, mobile or tablet) of less than 0.5% would put you among the bottom 20% of stores, and a rate below 0.2% would put you squarely among the worst-performing stores.
Using data to drive growth
Conversion rate is a live-and-die metric for stores of all sizes, but if you run a store without a diversified product line, you need to consistently track your store conversion rates — this includes conversions from individual product pages, click thrus and form fills on landing pages, and marketing campaigns, to name a few.
Larger catalog stores
The primary KPI with larger catalog stores is one we’ve already mentioned: average order value.
To maximize the chances of your customers spending more per purchase, encourage them to spend more during and after checkout.
The higher the AOV, the more income your store generates per order — it’s really that simple. Here are a few simple ways to boost AOV:
- Product bundles — offer several products in a “bundle” for a discounted price. PlayStation does a terrific job of creating product bundles with their gaming systems, controllers, branded accessories and even games to sweeten the cart for the user.
- Product upsells — persuade your customers to make an additional purchase (or to purchase something on your store with a higher price tag).
- Discounts on a minimum spend threshold — this isn’t nearly as complicated as it sounds. It simply means offering discounts that persuade your customers to spend more while making a purchase. All you have to do is decide a minimum spend line for your customers that makes the discount available to them.
Using data to drive growth
Merchants with stores that often receive repeat purchases can drive growth by integrating PPC data with ecommerce data. The best way to do this: connect Google Analytics with the marketing tools you know and love.
For merchants that use Facebook Ads, you know it’s no fun to trudge through limited reporting to make endless spreadsheets.
GA smart connections such as Littledata’s Facebook integration help you automate your PPC data and show accurate ROI on Facebook Ads. Merchants can use tools like these to view Facebook campaign data directly in Google Analytics without having to switch between platforms or play guessing games (“which conversion rate is actually accurate?”).
For merchants who use Google Ads, another smart connection works similarly. By retargeting ecommerce segments and connecting online sales with Google Ads, you get consistent ecommerce data while viewing Ads costs, sales columns and reports — all within Google Analytics. Plus you can see that GA data in Ads to get a better sense for overall ecommerce performance.
Subscription stores
For subscription stores, churn is everything — it’s the lifeblood of your store. Churn determines how successful your store is and how long it takes you to scale.
The Churn Rate formula is calculated as the number of churned / the total number of customers: number of churned customers / total number of customers
Number of churned customers refers to how many people left your service over the period out of the total number of customers you had during the period. Churn isn’t a standalone metric, though — for subscription ecommerce, it has wild domino effects.
How does churn affect other subscription metrics?
Because churn acts as a mirror of the value of your products, you should constantly optimize your storefront (and products) to minimize churn. When the product is aligned with your perceived value, your churn rates will (in theory) drop.
The metrics that churn primarily affects are recurring revenue, customer lifetime value (CLV), and customer acquisition cost (CAC):
- Monthly recurring revenue: when your customers leave, so does a part of your expected revenue. For ecommerce businesses, monthly recurring revenue (MRR) is 1) what keeps your company alive and 2) the main indicator of long-term viability. Churn hurts revenue, so it directly affects MRR=.
- Customer lifetime value: the CLV of your customers offer a strong prediction of the profitability and longevity of your store. When users leave, the prospective value or revenue goes unearned, therefore decreasing CLV.
- Customer acquisition cost: churn increases your average CAC. If you are doing everything possible to reduce churn, you can quickly get back a lower CAC from your users.
Using data to drive growth
For subscription stores, affiliate marketing tools like Refersion can help you track and improve promotions.
By tracking details such as on-site search and product list views within Google Analytics, you can gauge the interest level of buyers and design retargeting campaigns tailored to their online behaviour.
In fact, Refersion connections like this one help you get specific with this type of larger catalog data — which product pages repeat visitors from affiliate campaigns are going to (and how this compares to industry standards).
ReCharge is another game-changing tool designed specifically for subscription-based stores. As the most popular recurring billing solution for Shopify and Shopify Plus, ReCharge helps merchants sell subscriptions easily and smoothly.
ReCharge’s feature set also allows for a variety of subscription types, including single product, mixed cart & entire cart subscriptions.
Keeping in mind those essential metrics like product list views, ecommerce managers for larger-catalog brands can dive into CRO strategies based not necessarily on more detailed views of products but also on less detailed views — the KPIs that come from zooming out as much as zooming in.
By looking at product category performance such as product list views by category as well as product details such as product color and product size, you can make seemingly small changes that lead to big leaps in revenue.
Thinking into the future
As online retail and shopper expectations continue to balloon, it’s crucial for merchants to have a firm grasp of their data.
To that end, Google Analytics offers something no other data platform can — full capability to bring in data from other platforms, ensure its accurate, and help turn it into actionable insights.
With GA’s robust reporting system, custom features and segmenting tools, it’s simply a better choice for merchants who want to scale their store faster. But it begins with tracking the KPIs that really matter.
Happy tracking!