
The 3 Essential Ecommerce Analytics Reports You Need to Boost Sales & How to Set Them Up
Do analytics reports make you feel dumb?
Join the club.
It’s an all-too-common feeling amongst us marketers who are responsible for things like increasing traffic, boosting engagement, testing, and most importantly: increasing conversions.
I didn’t ever feel like I truly understood how to read analytics reports correctly until I found a step-by-step review of d how to create and interpret the reports I wanted.
Ecommerce analytics reports don’t have to make you feel lost. In fact, once you understand how to set them up and interpret them you’ll feel the exact opposite!
[content_upgrade] Free Bonus: This blog post goes into great detail about setting up 3 essential reports for your online store. We’ve compressed it into a comprehensive PDF for you so you can read it later and / or share it with your team! Click Here to Download the Step-by-Step Setup PDF Guide >[/content_upgrade]
Why is Analytics Reporting for Ecommerce Essential for You?
If you’re a growing ecommerce company, your site’s user experience (UX) is changing just as fast as you are growing. The more site visitors you acquire, the more UX problems you have.
More customers means more channels, more device-types, more browsers, and more things that can potentially go wrong.
This means you need to be pulling the most relevant and accurate data to make sure your team can make smart, data-based decisions.
Data always wins!
So, let’s check out 3 reports that you need to set up immediately and why:
Product Performance Report
⭐️ WHY: To See What Products Are Performing Best
Using a product performance report will make you feel like a spy. In a good way.
The Google Analytics product performance report is best used to compare products.
This report allows you to see how much revenue was generated from an individual product, how many unique purchases occurred, the quantity sold, and average price. On top of that, it also let’s you map shopper engagement for a particular product.
Here’s a view of product metrics where you can see unique purchases, product revenue, average price, and average quantity.
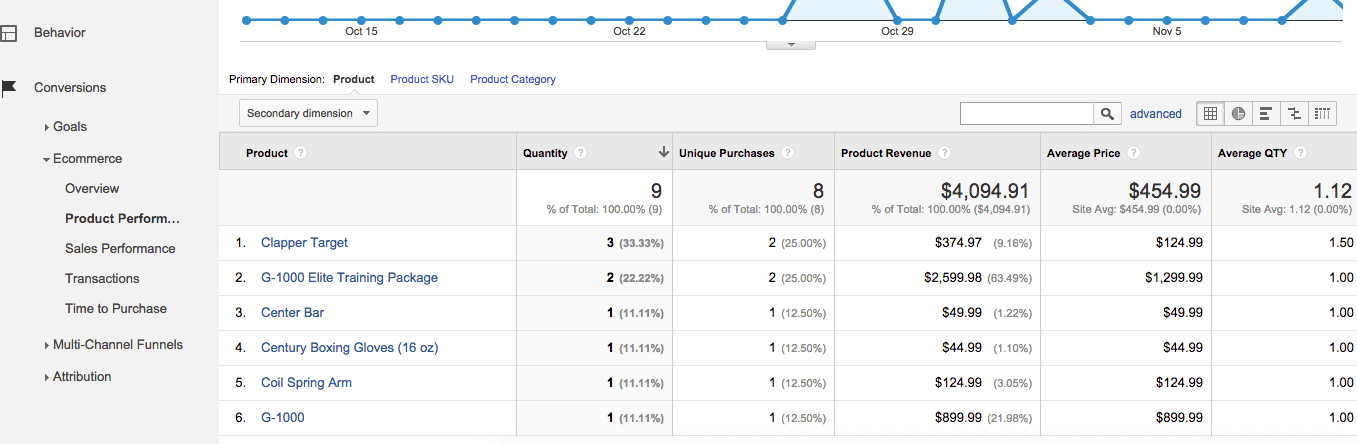

Being able to see this information allows you to, for example, determine which products with a low price point are selling in higher quantities, and give you the insight you need bundle them with more expensive items.
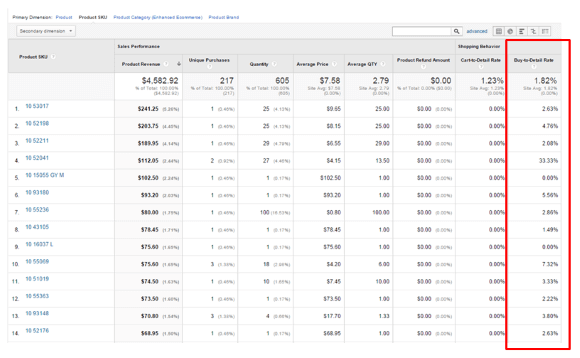
Another feature of this report gives you a view of customer behavior. We’ve highlighted the “buy-to-detail”, below, which allows you to see what products users are more likely to purchase after looking at the product details. From this you can gain insight into your ecommerce product page design.

How to Setup Product Performance in Your Google Analytics Account
To set this report up in your store’s Google Analytics account:
- Enable Enhanced Ecommerce from the Admin tab of your Google Analytics account
- In the View column, click on Ecommerce Settings
- Under Step 1, turn the Enable Ecommerce status to ON
- Click Next Step and then under Step 2 turn the Enhanced Ecommerce Settings to ON
- Go to the Conversions section to generate the Product List Performance Report
Alternatives to Google Analytics for Product Performance Data
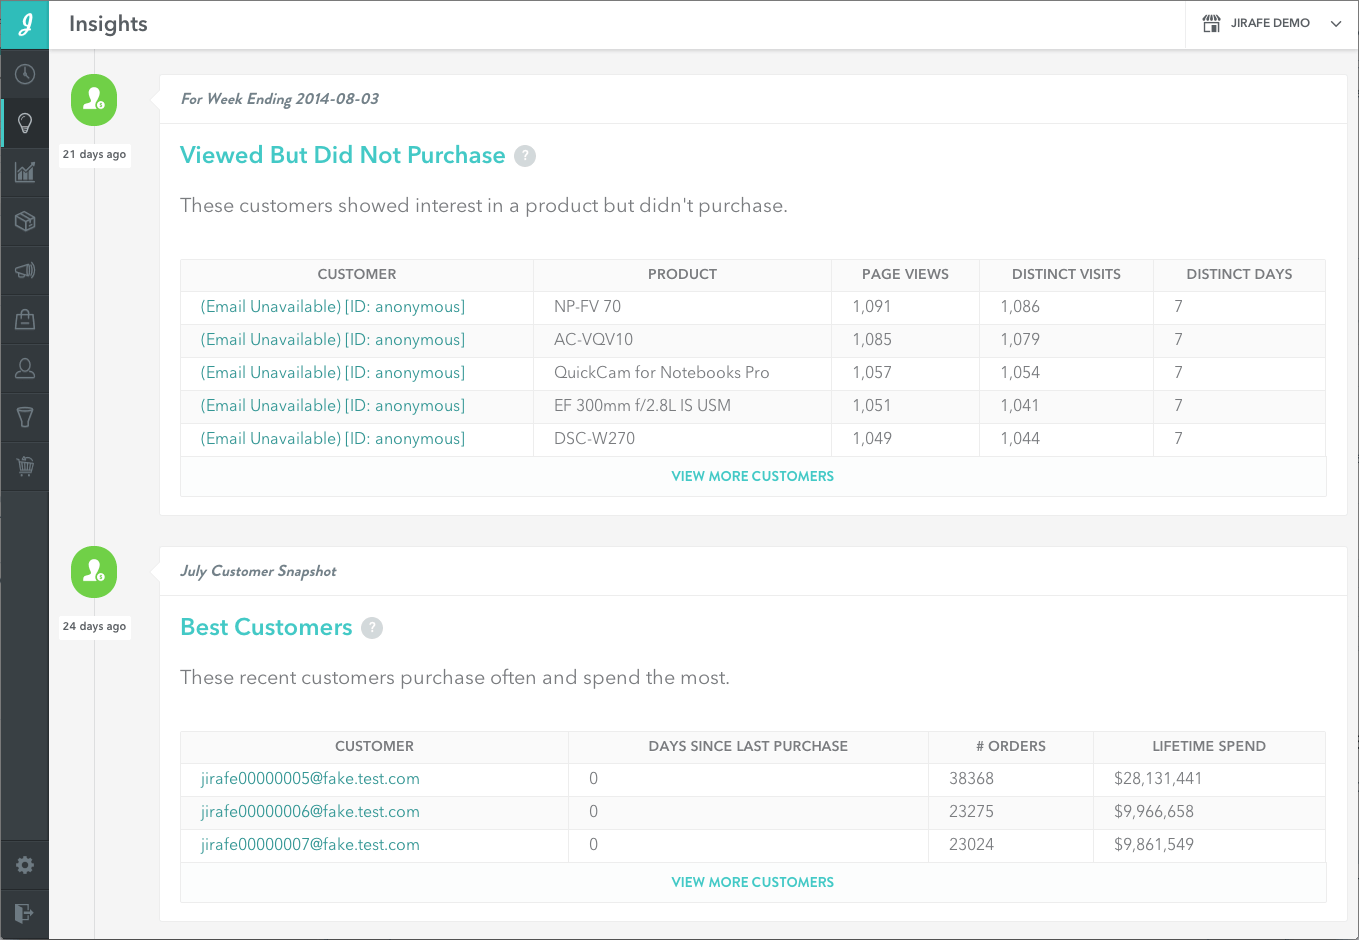
If you’re looking for an alternative way to report on similar metrics, many ecommerce analytics solutions offer this type of insight. For example, Jirafe (the ecommerce analytics software that currently powers Bigcommerce stores) allows you to view metrics like “customers who viewed but didn’t buy” or “customers with a low AOV”.
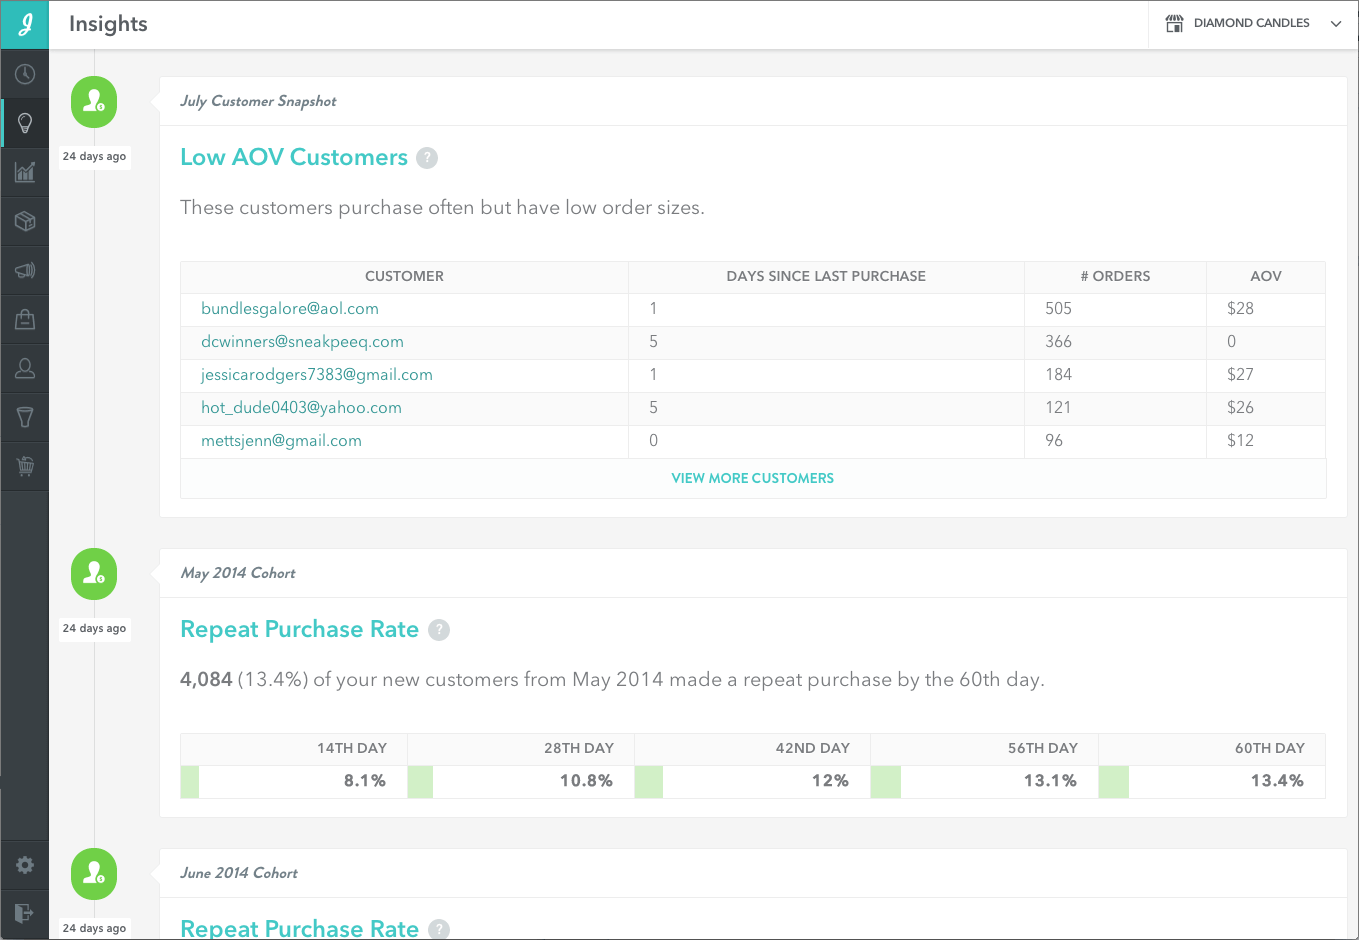

The difference between this solution and the Google report is that Jirafe’s metrics focus around the customer, while the Google Analytics product performance report focuses on the product.
Google Analytics gives you insight on your product based on the customer’s engagement with it. So, you’re always viewing it from the product-lens.
Jirafe’s analytics focus on the customer-centric data. For example, if you examine what customers are viewing and not purchasing you can make assumptions on why they aren’t purchasing.

You can read more about the Google Analytics Product Performance Report here.
Search Terms Report
⭐️ WHY: Learn What Content or Products Your Customers Are Looking For
This report simply shows how customers are using your site.
If you have a search function set up on your ecommerce site, it’s a huge oversight not to have this report in place.
The Google Analytics Search Terms report shows you:
- How many pages it took for visitors to find what they wanted
- How many visitors gave up and left the website
- Which keywords did not have good enough results, and forced users to refine their terms
- How persistent visitors were with their search query
- The most common search queries
- Trends and new searches
- Common misspellings or different ways people phrase the same search
- Which areas of the site people choose to use search for over using navigation
- Which queries led to high user engagement
- What search queries have the best conversion rates
Take a look at an example screenshot of this report:
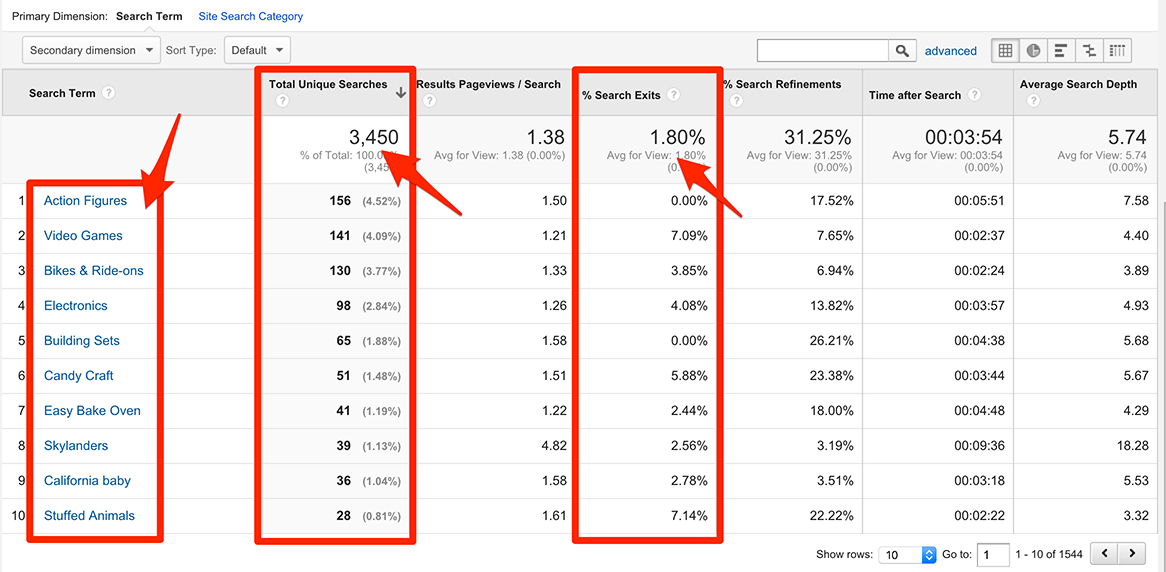

The percentage of Search Exits column shows where your visitors abandoned your site after doing a search, instead of clicking on any of the search results.
If this percentage is high, for example, it means your visitors didn’t find what they were looking for. You’ll need to fine tune your site search to provide more relevant search results (This entrepreneur fine-tuned his search function so well, he claims it’s his what sets him apart from his competitors in the crowded and competitive auto parts industry).
Seeing this search data can also allow you to optimize your website based on your user behavior. If you see a high number of searches for a specific term/phrase, you may consider featuring this product on a more prominent page or making it more obvious in your navigation or category page navigation/sub-menu.
Additionally, this report can give you insight on your website target keyword strategies:
- Look at your complete list of search terms. Do you have these in your PPC and SEO keyword targeting strategies? If not, you should: These are the terms your visitors are expecting to see on your site.
- Add traffic channel segments to see which channel drives the most internal searches. If a visitor is using site search to refine what they’re looking for, it could mean that they didn’t find your site from the right landing page and you need to iterate. (source)
How to Setup Site Search in Your Google Analytics Account
To set up the Search Terms report in your own Google Analytics account:
- On the top navigation, select Admin, select the view you use for your site, and click View Settings
- Set Site Search Tracking to ON
- Supply the field for Query Parameter or the manner in which your site identifies internal search terms (you can find help on that here)
- Select Strip query parameters out of URL to clean up your data
- Set Site Search Categories to ON if your internal site search has a way for your visitors to search within a category on your site
- Click Save
Then, to access the report once you set it up:
- Select the Reporting tab
- Select Behavior > Site Search
You can learn more about setting up Site Search in your Analytics account here.
Mobile Performance Report
⭐️ WHY: Capture Sales You’re Missing Because of Poor Mobile Performance
After making just four mobile UX optimizations, the well-known UK retailer Topshop saw an 11% increase in conversions! For a retailer that size, 11% can translate to well over 7 figures, so don’t let the small percentage fool you.
[rad_rapidology_inline optin_id=optin_12]
Pop quiz: Can you answer these questions about your store’s mobile performance?
- How does your page load time differ between Android and iOS?
- What is your average order rate from tablet visits?
- What’s your conversion rate from iOS?
If you know the answers, you will be able to optimize your sales based on device type.
It’s important to understand which device your most valuable customers are using so you can make sure you’re delivering an exceptional shopping experience to them.
You can also use this data to funnel more ads into a particular device type. If your your iPhone users have a higher AOV, for example, you can focus one of your Facebook Ad campaigns to deliver to iPhone users only.
On the flip side, it’s important to understand which device-types are performing poorly. That highlights room to improve and capture potential revenues.
How to View Mobile Performance in Your Google Analytics Account
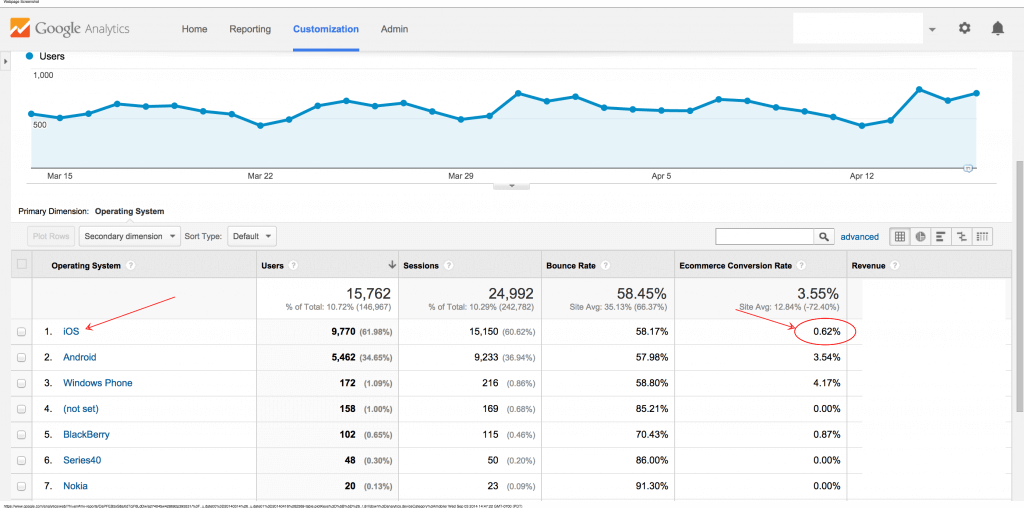
To see conversion rates around mobile devices in your Google Analytics:
- Log in to your account and select the correct view
- Navigate to Audience > Mobile > Devices
- Select Goal Set or Ecommerce (under the Explorer tab, upper left of report)
- Select the Data view (at top right of table) if not already selected.
- Look at Conversion Rates for your individual micro goals (or the Ecommerce Conversion Rate on the Ecommerce tab).

When you have this information available to you, you’ll be able to strategically deploy a plan for optimizing your store for devices that have the highest conversion rate.
You’ll also be able to gauge which devices are underperforming, and figure out what resources you want to allocate toward optimizing them to convert more.
How to Create a Mobile Performance Report Based on Browser & Segmented by Device in Your Google Analytics Account
Want to see this data in a custom report? You don’t have to worry about building anything if you’re not an analytics pro.
Someone’s built it for you!
There are numerous reports available for you from the Google Analytics Solutions Gallery. This link has the available reports filtered to mobile. You can find the one that best fits your needs, filter by “latest” and “most popular”.
Alternatives to Google Analytics for Mobile Performance Data
There are other solutions that can give you an analysis of your site’s mobile performance, but they are more complex than just the regular ol’ Google Analytics.
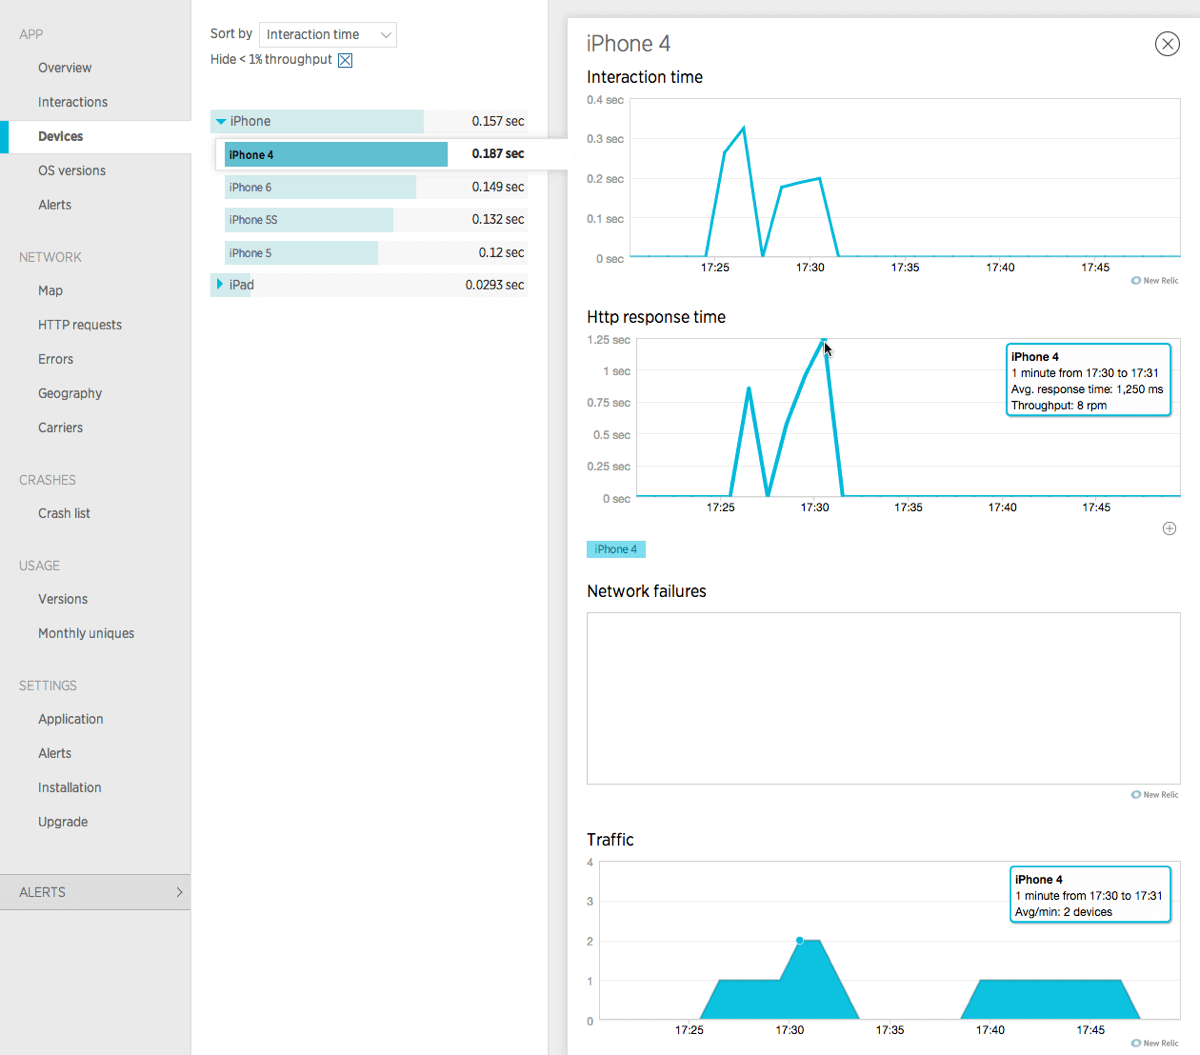
New Relic
New Relic is a tool used by many top-performing online retailers to monitor their customers’ experience on their website in real-time.
With this tool you have the ability to view the device type from which users are accessing your site, and even drill down deeper from the device. For example, from iPhone, you can drill down into the model.

Kissmetrics, Hubspot, Mixpanel
Kissmetrics, Hubspot and Mixpanel can provide you insight into your mobile performance. The only difference in these tools and Google Analytics is that the latter is a reporting tool by default.
These three have reporting as a feature and focus more on funnel development, directly relating to specific users (similar to the Jirafe example from the very beginning).

Depending on where you are in terms of company growth, investing in a more robust marketing solution like one of these can help you connect all the dots in your conversion funnel.
Benefits of Getting the Right Ecommerce Analytics Reports Setup
Once you set up the analytics reports to show your product performance, site search and mobile performance, you’ll feel like you just got your eyes back (shoutout to Arya from Game of Thrones – spoiler alert: don’t click if you’re behind!).
Armed with data you’ll be able to discover and prioritize optimizations for your team to implement. Here’s how to get moving:
- Set up a product performance report
- Decide what products are performing worst and best: make changes accordingly
- Take a look at your site search info
- See what people are looking for and adjust your nav, filters, content, & ads
- GET A GRIP ON MOBILE!
- Make sure your customer user experience (UX) is just as seamless on desktop as it is mobile (especially the checkout)
I know there’s many more useful reports to add to the three I’ve outlined in this article. Let me know in the comments which ones you find most useful and why.
[rad_rapidology_inline optin_id=optin_20]